Diagrams and Doodles
Diagrams and Doodles
How do diagrams and doodling fit into strategy consulting? They’re related and adjacent. I believe doodling and diagrams are good practice for creating frameworks. See my post here for more on that:
Below are some interesting diagrams, doodlers and examples I’ve collected. Hopefully I’ll keep this updated:
Venkatesh Rao of Ribbonfarm fame
Venkatesh has tons. Drawings, doodles, diagrams, flows and more. Some faves:

1/ Lemme do a 1-slide presentation since I'm feeling job sick. Title: How to Actually Manage Attention Without Smashing Your Phone and Retreating to a Log Cabin pic.twitter.com/kEPZUh7g50
— Venkatesh “Tetris” Rao (@vgr) October 4, 2018
https://www.ribbonfarm.com/2014/09/03/how-to-fall-off-the-wagon/
https://www.ribbonfarm.com/2018/07/19/quiver-doodles/
https://www.ribbonfarm.com/2017/06/06/thingness-and-thereness/
Many beginning consultants have a weird kind of insecurity that leads them to invent and rely on over-complicated, bespoke constructs that they can name after themselves. While these can sometimes be useful, especially ones that are developed and refined over many years, across hundreds of applications, such as Wardley maps, in general, they are fragile visual bullshit. You’re much better off learning to use the basic commodity diagrams well than trying to make up and sell your own in most cases.
source: Basic Consultant Diagrams - The Art of Gig
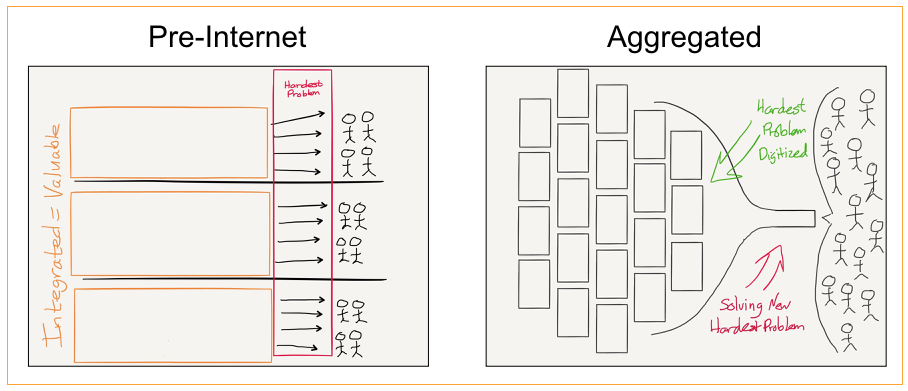
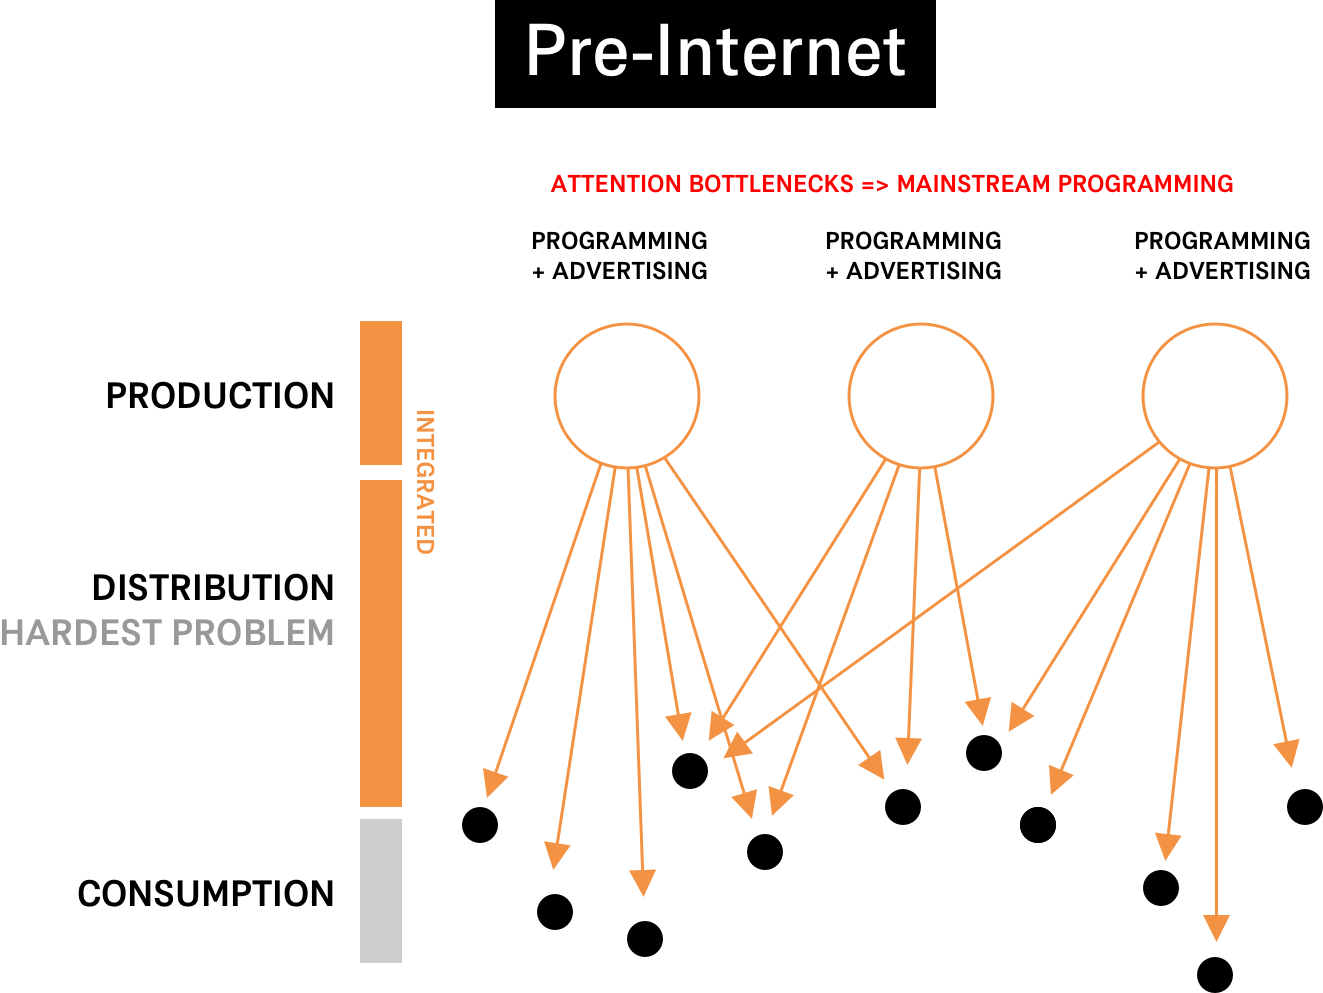
Ben Thompson of Aggregation theory fame
https://stratechery.com/aggregation-theory/
Toby Shorin of Subpixel Space fame
https://subpixel.space/entries/diminishing-marginal-aesthetic-value/
https://subpixel.space/entries/each-binary-contains-a-universe/
Mark Pollard
All the good stuff is on Instagram: @markpollard
Nahee cyberdiagrams (nsfw)
The best instagram account I follow. Hands down.
Imagine a venn diagram of cyberfeminism, erotica, developer manuals, code and art. Mildly NSFW:
https://www.instagram.com/nahee.app/
Think Clrly

Hugh MacLeod
Ex-ad-agency starts doodling on business cards. Gets good. Becomes famous. Turns doodling into a strategy consulting firm. Magic.
https://twitter.com/hughcards?lang=en
Wardly Maps
Related to the frameworks and diagrams idea is the notion of “wayfinding” in strategy. Most famously Wardly Maps. More on that here: https://medium.com/wardleymaps
And there’s a fun tool to build your own here:
Misc
Maps of the mind looks delicious.
Good deck of visual slides from Julian Cole here
But beyond their two-dimensional depictions of a physical world, maps also afford us the freedom to express the cosmos; to make all kinds of ideas about the spatial relationships of multiple components unexpectedly clear. To draw one is an effective way to establish order on an otherwise chaotic environment. To make it navigable. To make it rational.
source: The Importance of Visualisation
Emissaries guide to worlding - a lovingly designed book that has tons of interesting diagrams in it.
–
In one of the classes I teach at CCA, students were confused by mental models, conceptual models, concept maps, etc. I ended up drawing a taxonomy for models on the whiteboard, and it may help others.
source: Five Models for Making Sense of Complex Systems – Christina Wodtke – Medium
And:
https://medium.com/@cwodtke/a-visual-vocabulary-for-concept-models-f771b2b2e9
–
diagrams of thought - massive arena channel!
https://twitter.com/geoffwilsonUX/status/912918557679288320
https://twitter.com/BorisAnthony/status/1144539930699423744
Synthesis maps and gigamaps (browse the archives!)
WHOAH: one page designs - hour video explaining how to make one page system designs. Incredible. (and slides here)
–
How Domain Experts Create Conceptual Diagrams and Implications for Tool Design
–
Speculative Drawing: 2011–2014
source: Speculative Drawing: 2011–2014
–
I only recently learned about Lawrence Halprin’s RSVP cycles, which proposed scores “as a way of communicating [artistic + environmental] proceesses over time and space… + as a vehicle to allow many people to enter into the act of creation together.”
source: Shannon Mattern on Twitter
–
diagram online with excalidraw
–
Sketching Science in the Seventeenth Century
What constitutes a sketch? We think at first of drawings and diagrams, but there are other forms of sketching. The OED offers several pertinent uses of the term, none of them earlier than the late 17th century. The first refers to the visual arts: “A rough drawing or delineation of something, giving the outlines or prominent features without the detail, esp. one intended to serve as the basis of a more finished picture, or to be used in its composition; a rough draught or design. Also, in later use, a drawing or painting of a slight or unpretentious nature.” The second extends it to literary creations: “A brief account, description, or narrative giving the main or important facts, incidents, etc., and not going into the details; a short or superficial essay or study, freq[uently] in pl[ural] as a title.” A third, rare usage, makes a sketch simply “[t]he general plan or outline, the main features, of anything”. One can find all three sorts of sketches at work in the formation of the new science of the seventeenth century.
Source: Sketching Science in the 17th Century
http://www.xplaner.com/visual-thinking-school/
https://twitter.com/nicolasnova/status/1376581318637670400
https://davidhoang.substack.com/p/sketching-as-a-strategy?ref=uxdesignweekly
https://www.amazon.com/Sketching-User-Experiences-Interactive-Technologies/dp/0123740371/
https://syllabusproject.org/diagrams/
https://www.oarplatform.com/response/cartography-research-process-visual-essay/
https://syllabusproject.org/diagrams/
https://www.are.na/sim-polism/psychoanalysis-diagrams